If you asked « How to modify pdf files or How to edit pdf files ?? », especially for R figures, your are in the right place !
Inkscape is an open-source software under General Public License used to edit or create vectors graphics. I use it when I have to modify legends or axis of my figures (exported in pdf from R).
Inkscape let you modify, magnify, change color, add text, point, lines, shaded-box and so on. Once open, there is plenty of menu and mode. Internet is fill of tutorials and guides to take the full potential of this tool. I submit to you some explanation about basics to achieve your goal quickly (modifying/magnifying axis labels, legends, … ).
Generating the figure
Let’s begin by generating a figure correctly formated :
pdf("Raw-Figure.pdf")
plot(density(rnorm(1000 ,0, 1)))
dev.off()
As you might know, PDF format keeps track of vectorial composition of your work. It could be easily edited using Inkscape.
Modifying the figure
Object and path mode
Once open, (by drag and drop or from the « File->Open » ), you should be able to directly edit the different objects. By default, you should be in the « object selector mode » (an arrow at the top of the left menu).
For example, if we want to modify the frame around the R graph, we will select the frame object. From this point, and depending the number of click we did, we are on the object selector mode or the path mode :
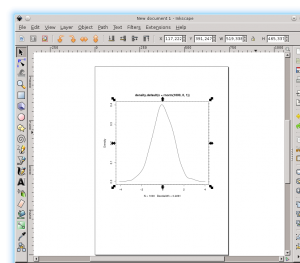
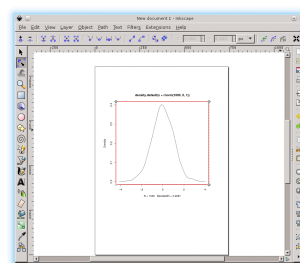
Changing the frame style
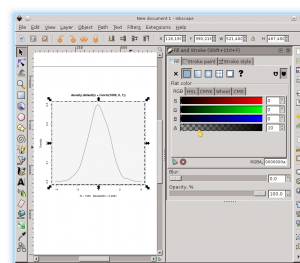
The frame object is possessing some « Fill and Stroke » properties, which can be modified from the top menu « Object->Fill and Stroke« . Here I modified the frame to have a dashed stroke of 3px width.
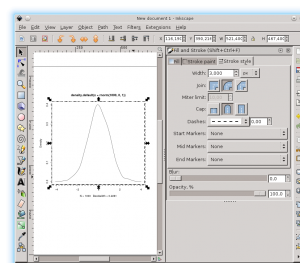
Similarly, I edit the property of the Fill to obtain a grey-shaded (RGBa : 0:0:0:10). Be aware that this object have position dependent of others objects. The frame could be put in background from the top menu : « Object->Lower to Bottom » or by using the « end » short-key.
Changing the size of the frame
We can change the size of the frame to include axis labels and the top title. Two option are possible :
i) using the « Object mode », by dragging the corner or by using the top menu « Object->Transform, sub-menu:Scale« . When increasing the frame, width stoke property increased (3px-> 3.7px).
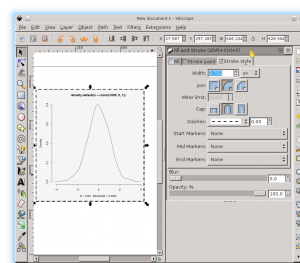
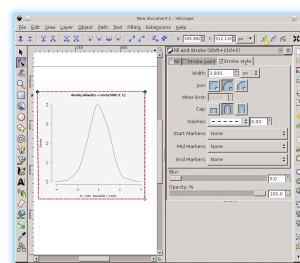
ii) using the » Path mode » by selecting the frame in Path mode. By selecting side nodes or top nodes and moving them with keyboard’s arrows. This way doesn’t modify the stroke width, which could be important.
Depending on your goals (increased one or multiple elements), it will be more relevant to use a mode than an other.
Modifying text objects
Texts can be edited easily by clicking on it. You should be able to change the font, size, form, … For the example, we will first modify the title, and change the font of all the text objects.
Select the title and be sure to be on the right mode (F8 or double click from the « object mode ») and type a new name for your beautiful graph :
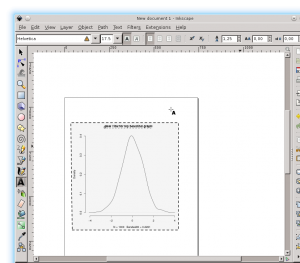
Then to modify globally the font (i.e. for different text object at once), I select manually every text object I want (shift key) and change the font from the corresponding Top menu (“Text->Text and Font”). If you know a better trick, let me know 😉
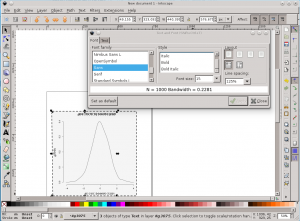
Resize the page to the content
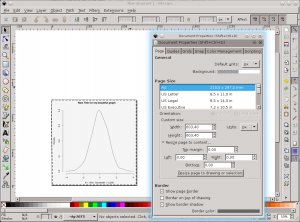
At the end, a tricks to think is to resize the page to contents using the right option inside the Top menu : « File->Document Properties”.
Finally you can export your object as bitmap (in ‘.png’ for exemple), as vectorial object (pdf, svg, …) or whatever format supported by Inkscape in the top Menu « File-> Save » as or « File->Export« .
I hope it helps you a bit. If you find it useful or if you have others recipes and tricks, let me know 😉
Thanks to Julie Toury, she helped me to correct mistakes and to clarify some points.
